pod里没有tcpdump等网络调试命令,如何调试/抓取网络数据包?
前言
由于镜像中只包含核心命令,运行成Pod容器之后,在其中做一些调试动作,比如tcpdump抓包,ping测试,curl访问等,命令都是没有的。当然你可能想用apt,yum等命令安装它们,但是很遗憾,大部分情况apt,yum命令也是没有的。
应对这类问题,本文介绍两种容器中网络调试的方法:nsenter命令和netshoot镜像****
- nsenter (宿主机进入容器进程namespace)
- netshoot (附加到容器上)
预备知识
在开始之前,你需要了解namespace技术,它是Linux内核中的一个feature,用于实现进程之间的隔离。cgroup实现对进程的资源限制及管理。
直观点的图示: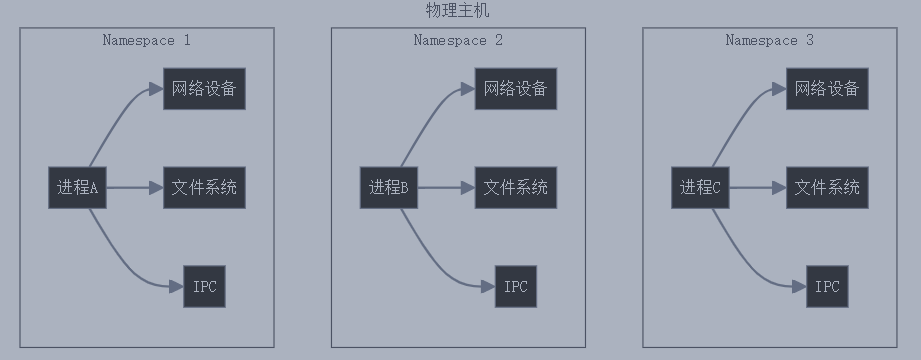
namespace技术为进程创建一个独立的“空间”,类似一个大房子中有很多小房子,之间互不干扰,且各个房间中的进程认为自己是独占整个系统资源的。Linux提供了多种类型的namespace,包括PID,Network,Mount,IPC,UTS,User,Time,Cgroup等,每个类型负责隔离不同的系统资源。
nsenter命令
nsenter是 Linux 提供的一个命令行工具,可以让我们进入特定的命名空间(Namespace)。它适用于调试容器、Kubernetes Pod,或直接进入某个进程,使用宿主机系统的命令进行调试,排查(其原理是通过指定选项进入目标命名空间:如容器的 mount namespace,或选择保留宿主机的 mount namespace 以使用其文件系统)。解决容器缺少命令的问题。
1. 安装方式
直接安装util-linux, 其中包含nsenter命令
sudo yum install -y util-linux

/usr/bin/nsenter
[root@centos8-1 ~]# nsenter -h

Usage:
 nsenter [options] [<program> [<argument>...]]

Run a program with namespaces of other processes.

Options:
 -a, --all              enter all namespaces
 -t, --target <pid>     target process to get namespaces from
 -m, --mount[=<file>]   enter mount namespace
 -u, --uts[=<file>]     enter UTS namespace (hostname etc)
 -i, --ipc[=<file>]     enter System V IPC namespace
 -n, --net[=<file>]     enter network namespace
 -p, --pid[=<file>]     enter pid namespace
 -C, --cgroup[=<file>]  enter cgroup namespace
 -U, --user[=<file>]    enter user namespace
 -S, --setuid <uid>     set uid in entered namespace
 -G, --setgid <gid>     set gid in entered namespace
     --preserve-credentials do not touch uids or gids
 -r, --root[=<dir>]     set the root directory
 -w, --wd[=<dir>]       set the working directory
 -F, --no-fork          do not fork before exec'ing <program>
 -Z, --follow-context   set SELinux context according to --target PID

 -h, --help             display this help
 -V, --version          display version
2. 操作使用
nsenter基本用法:
nsenter [options] [program [arguments]]
主要参数选项
| 选项 | 作用 |
|---|---|
--target <PID> |
指定要进入的进程 ID |
--mount, -m |
进入目标进程的挂载命名空间(Mount Namespace),用于访问其文件系统 |
--uts, -u |
进入目标进程的 UTS 命名空间,可以修改主机名 |
--ipc, -i |
进入目标进程的 IPC 命名空间,共享 System V IPC 资源(如消息队列、信号量) |
--net, -n |
进入目标进程的网络命名空间,访问其网络栈 |
--pid, -p |
进入目标进程的 PID 命名空间,管理进程树 |
--cgroup |
进入目标进程的 Cgroup 命名空间,查看资源限制 |
--user, -U |
进入目标进程的用户命名空间,切换到其用户身份 |
--all, -a |
进入目标进程的所有命名空间 |
--setuid <UID> |
切换到指定的用户 ID |
--setgid <GID> |
切换到指定的用户组 ID |
--preserve-credentials |
保持当前用户的 UID/GID,而不切换到目标进程的用户身份 |
--no-fork |
不创建新进程,直接执行命令 |
--wd <dir> |
进入后切换到指定工作目录 |
--help |
显示帮助信息 |
案例1:进入nginx容器的net命名空间(进程同理)
[root@localhost ~]# docker inspect -f {{.State.Pid}} nginx
3047

[root@localhost ~]# nsenter --target 3047 --net

[root@localhost ~]# ip a

[root@centos8-1 ~]# exit
logout
不分配tty,只在当前terminal有效,exit退出namespace
案例2:进入nginx pod的net、uts命名空间
1.查看pod
[root@localhost ~]# kubectl get po
NAME                            READY   STATUS    RESTARTS   AGE
nginx-deploy-7bf8c77b5b-x45dj   1/1     Running   0          4d

2.获取容器ID
[root@localhost ~]# CONTAINER_ID=$(kubectl get pod nginx-deploy-7bf8c77b5b-x45dj -o jsonpath='{.status.containerStatuses[0].containerID}' | cut -d '/' -f3)

3.获取对应容器的进程PID
[root@localhost ~]# PID=$(nerdctl inspect -f '{{.State.Pid}}' $CONTAINER_ID)

[root@localhost ~]# PID=$(docker inspect -f '{{.State.Pid}}' $CONTAINER_ID)

[root@localhost ~]# echo $PID
44125

4.通过进程进入namespace
[root@localhost ~]# nsenter --target $PID --net --uts -- bash

[root@nginx-deploy-7bf8c77b5b-x45dj ~]# netstat -naplt

5.抓取容器内数据包
[root@localhost ~]# nsenter --target $PID --net --uts tcpdump -i eth0
操作日志
[root@centos8-1 ~]# kubectl get po
NAME    READY   STATUS    RESTARTS   AGE
nginx   1/1     Running   0          3h37m
[root@centos8-1 ~]# CONTAINER_ID=$(kubectl get pod nginx  -o jsonpath='{.status.containerStatuses[0].containerID}' | cut -d '/' -f3)
[root@centos8-1 ~]# PID=$(docker inspect -f '{{.State.Pid}}' $CONTAINER_ID)
[root@centos8-1 ~]# echo $PID
8411
[root@centos8-1 ~]# nsenter --target $PID --net --uts -- bash
[root@nginx ~]# ip a
1: lo: <LOOPBACK,UP,LOWER_UP> mtu 65536 qdisc noqueue state UNKNOWN group default qlen 1000
    link/loopback 00:00:00:00:00:00 brd 00:00:00:00:00:00
    inet 127.0.0.1/8 scope host lo
       valid_lft forever preferred_lft forever
2: tunl0@NONE: <NOARP> mtu 1480 qdisc noop state DOWN group default qlen 1000
    link/ipip 0.0.0.0 brd 0.0.0.0
4: eth0@if13: <BROADCAST,MULTICAST,UP,LOWER_UP> mtu 1440 qdisc noqueue state UP group default
    link/ether be:97:0f:59:87:1f brd ff:ff:ff:ff:ff:ff link-netnsid 0
    inet 192.168.11.215/32 scope global eth0
       valid_lft forever preferred_lft forever

[root@nginx ~]# curl -I 127.0.0.1
HTTP/1.1 200 OK
Server: nginx/1.27.4
Date: Wed, 19 Mar 2025 04:45:54 GMT
Content-Type: text/html
Content-Length: 615
Last-Modified: Wed, 05 Feb 2025 11:06:32 GMT
Connection: keep-alive
ETag: "67a34638-267"
Accept-Ranges: bytes

[root@nginx ~]# exit
exit

[root@centos8-1 ~]# ping 192.168.11.215
PING 192.168.11.215 (192.168.11.215) 56(84) bytes of data.
64 bytes from 192.168.11.215: icmp_seq=1 ttl=64 time=0.163 ms
64 bytes from 192.168.11.215: icmp_seq=2 ttl=64 time=0.236 ms
64 bytes from 192.168.11.215: icmp_seq=3 ttl=64 time=0.131 ms
^C
--- 192.168.11.215 ping statistics ---
3 packets transmitted, 3 received, 0% packet loss, time 2069ms
rtt min/avg/max/mdev = 0.131/0.176/0.236/0.046 ms
[root@centos8-1 ~]#

[root@centos8-1 ~]# nsenter --target $PID --net --uts tcpdump -i eth0
dropped privs to tcpdump
tcpdump: verbose output suppressed, use -v or -vv for full protocol decode
listening on eth0, link-type EN10MB (Ethernet), capture size 262144 bytes
04:46:39.031914 IP 10.0.2.15 > nginx: ICMP echo request, id 2, seq 1, length 64
04:46:39.031973 IP nginx > 10.0.2.15: ICMP echo reply, id 2, seq 1, length 64
04:46:39.033502 IP nginx.37879 > 10.0.2.3.domain: 43384+ PTR? 215.11.168.192.in-addr.arpa. (45)
04:46:39.254197 IP 10.0.2.3.domain > nginx.37879: 43384 NXDomain 0/1/0 (122)
04:46:39.254996 IP nginx.51333 > 10.0.2.3.domain: 43784+ PTR? 15.2.0.10.in-addr.arpa. (40)
04:46:39.275903 IP 10.0.2.3.domain > nginx.51333: 43784 NXDomain 0/1/0 (117)
04:46:39.276994 IP nginx.45333 > 10.0.2.3.domain: 19366+ PTR? 3.2.0.10.in-addr.arpa. (39)
04:46:39.481650 IP 10.0.2.3.domain > nginx.45333: 19366 NXDomain 0/1/0 (119)
04:46:40.077050 IP 10.0.2.15 > nginx: ICMP echo request, id 2, seq 2, length 64
04:46:40.077183 IP nginx > 10.0.2.15: ICMP echo reply, id 2, seq 2, length 64
04:46:41.100897 IP 10.0.2.15 > nginx: ICMP echo request, id 2, seq 3, length 64
04:46:41.100969 IP nginx > 10.0.2.15: ICMP echo reply, id 2, seq 3, length 64
^C
12 packets captured
12 packets received by filter
0 packets dropped by kernel
案例3:进入nginx pod的net命名空间,并切换到/etc目录
nsenter --target $PID --net --uts --wd=/etc -- bash
操作日志
[root@centos8-1 ~]# nsenter --target $PID --net --uts --wd=/etc -- bash

[root@nginx etc]# pwd
/etc
[root@nginx etc]# ip a
1: lo: <LOOPBACK,UP,LOWER_UP> mtu 65536 qdisc noqueue state UNKNOWN group default qlen 1000
    link/loopback 00:00:00:00:00:00 brd 00:00:00:00:00:00
    inet 127.0.0.1/8 scope host lo
       valid_lft forever preferred_lft forever
2: tunl0@NONE: <NOARP> mtu 1480 qdisc noop state DOWN group default qlen 1000
    link/ipip 0.0.0.0 brd 0.0.0.0
4: eth0@if13: <BROADCAST,MULTICAST,UP,LOWER_UP> mtu 1440 qdisc noqueue state UP group default
    link/ether be:97:0f:59:87:1f brd ff:ff:ff:ff:ff:ff link-netnsid 0
    inet 192.168.11.215/32 scope global eth0
       valid_lft forever preferred_lft forever
netshoot镜像
netshoot是一个Docker/Kubernetes网络故障排查容器,其中包含了各种各样的排查命令,是一个强大的工具。
官方图示: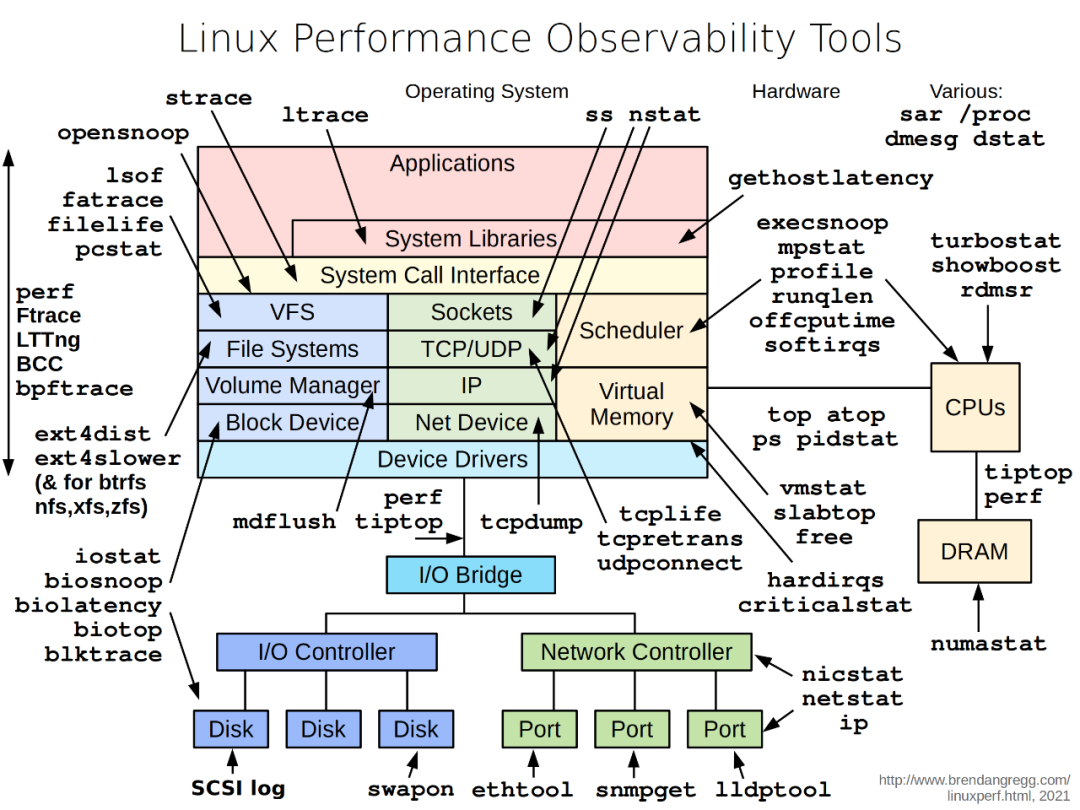
1. 镜像下载
# docker仓库
docker pull nicolaka/netshoot
# 国内仓库
docker pull registry.cn-hangzhou.aliyuncs.com/week-cnative/netshoot:latest
2. 操作使用
- docker中的基本用法
#在现有网络空间中运行netshoot,并连接目标容器。

docker run -it --net container:<container_name/id> nicolaka/netshoot
- kubernetes中的基本用法
# debug模式下进行测试,连接目标容器
# <pod-name>: 需要调试的pod名称
# --target: 目标容器, pod中会包含1个和多个容器, 假如只有1个容器, 这里可以不写--target; 假如有多个容器, 可以执行连接到具体的容器

kubectl debug -it <pod-name> --image=nicolaka/netshoot --target=<container-name>
kubernetes v1.20+
实践案例1:假设有两个容器 app1 和 app2,app1 无法连接到 app2
# 启动 netshoot 附加到 app1 的网络命名空间
docker run -it --net container:app1 nicolaka/netshoot

# 检查网络配置
ifconfig
ip route

# 测试与 app2 的连接
ping <app2_ip>
traceroute <app2_ip>
nc -zv <app2_ip> <port>

# 抓包分析
tcpdump -i eth0 host <app2_ip>
实践案例2:假设有一个 Pod 无法正常访问服务
# 使用 netshoot 附加到目标 Pod 的网络命名空间
kubectl debug -it problem-pod --image=nicolaka/netshoot --target=<container-name>

# 检查 DNS 解析
dig kubernetes.default.svc.cluster.local
dig <service-name>.<namespace>.svc.cluster.local

# 检查服务连接性
curl -v <service-ip>:<port>

# 检查网络策略
iptables-save | grep <service-ip>